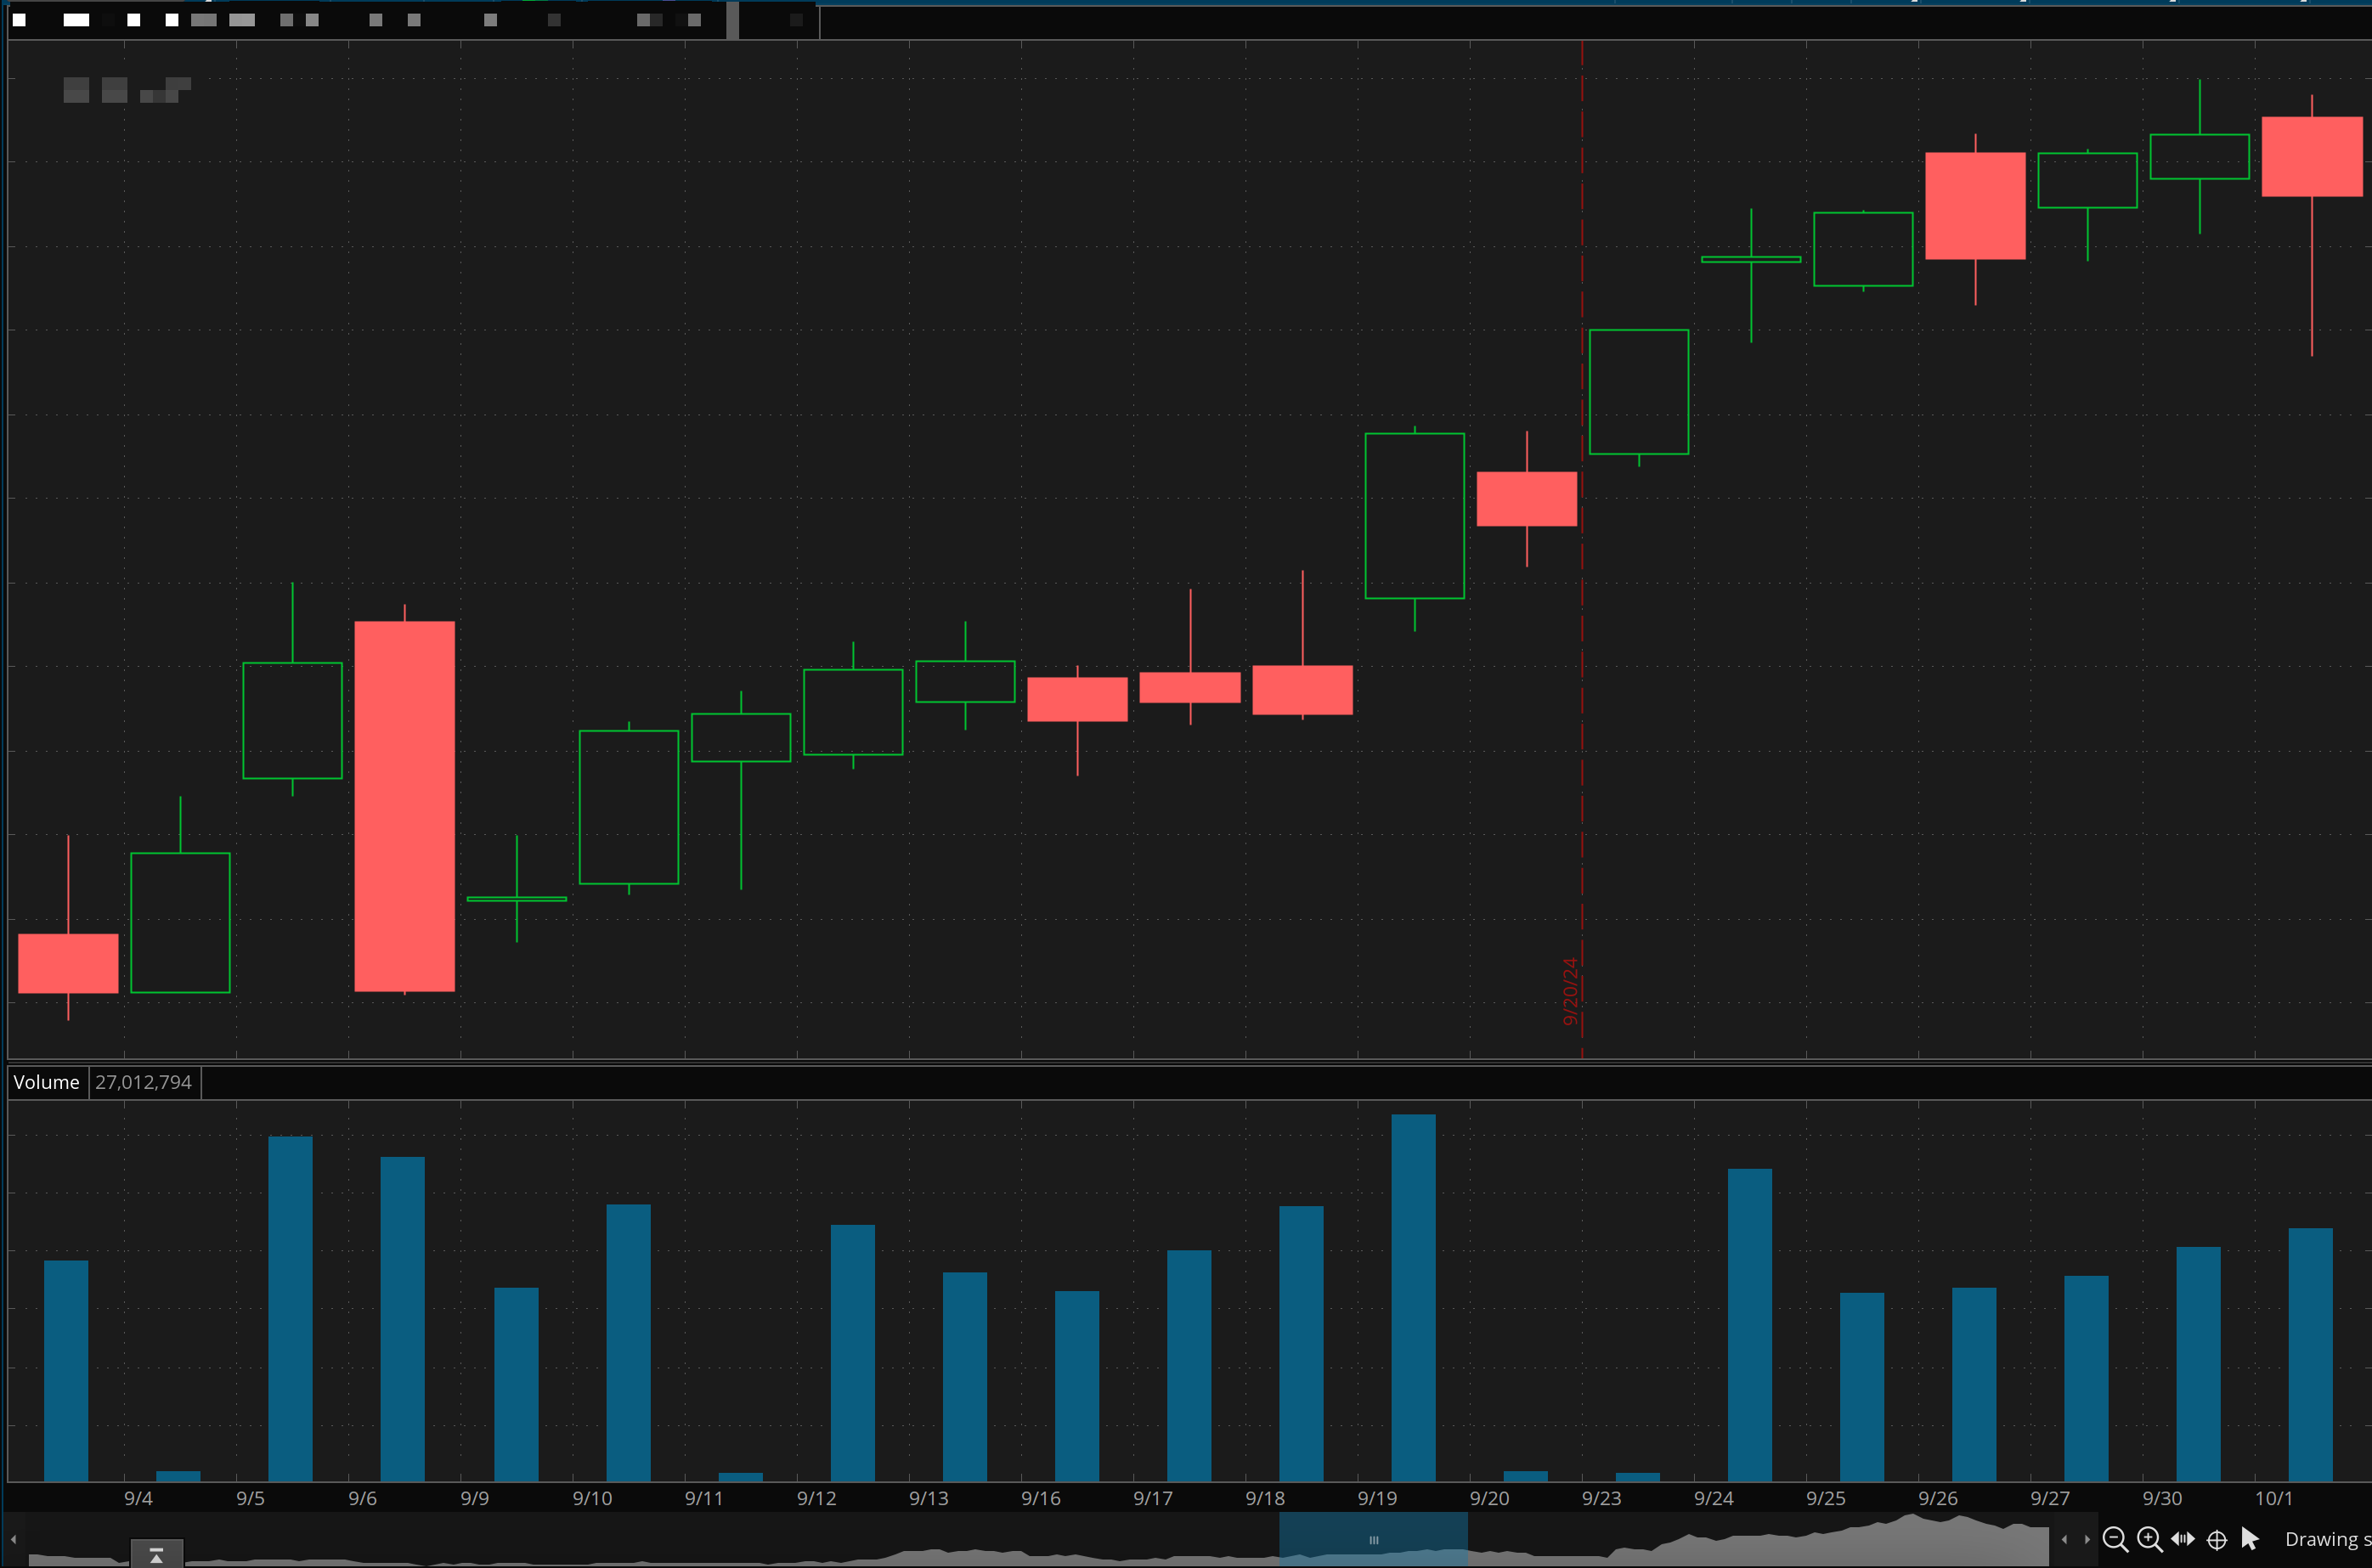
The Chart Navigator is a pane that provides the bird's eye view of the main chart for the active symbol. It replaces the general time axis scrollbar. Using it, you can see the full picture of the price action on the selected chart time interval not limited to the data currently visible on the main chart.
To use the Chart Navigator:
- Enable the Chart Navigator in the Time Axis Settings. This will add the Chart Navigator pane below the volume or the bottom study subgraph.
- The area corresponding to the currently visible part of the main chart will be highlighted in the Chart Navigator; if the current view contains all chart history, the highlighting will not be shown. You can click and drag the 'thumb' icon to move the highlighted area and instantly see the corresponding main chart move to the corresponding time period.
- For granular movements, one candle to the left or right, use the triangle arrow icons.
Chart Navigator is only available in the Standard chart mode.
