Description
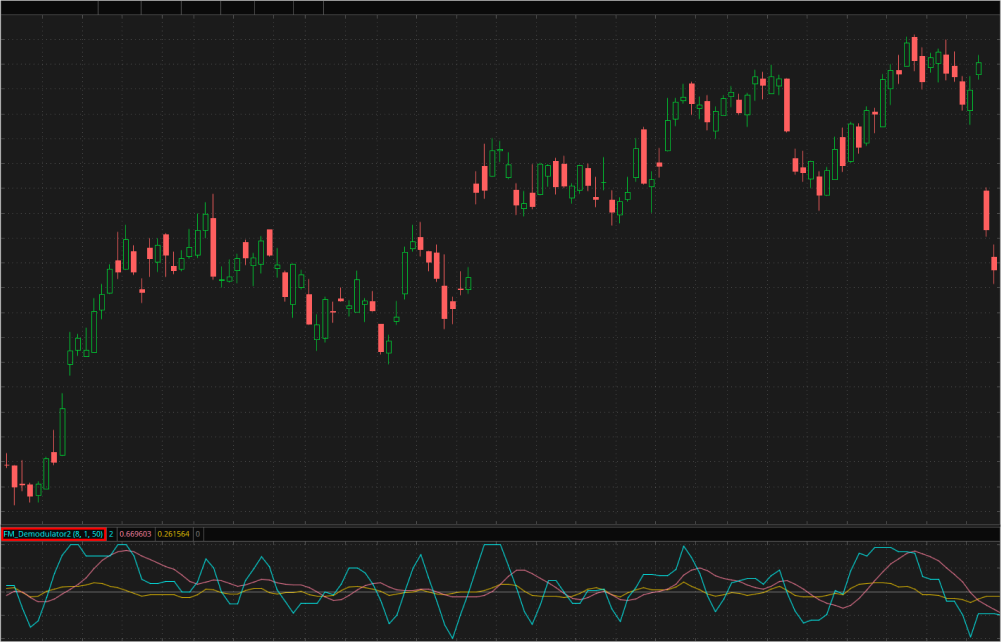
The modified FM Demodulator is a technical indicator that singles out the frequency modulation component out of market data cycles. It does so by applying a hard limiter that eliminates all amplitude information from the market data spectrum. Based on signal processing techniques, this indicator can help detect potential turning points in market data. As opposed to the plain FM Demodulator, it calculates the hard limiter filter based on the two-bar price momentum instead of the difference between the close and open.
The modified FM Demodulator is calculated as follows:
- A hard limiter is applied to the two-bar close price momentum: the momentum times two is divided by its root mean square, and the results are cut off to fit the -1 to +1 range.
- The sum of the four last hard limiter values is found (plot
Timing).
In addition, the study generates two additional plots used by the SimpleROCStrat strategy:
Signal. A simple moving average ofTiming.ROC. The rate of change ofSignal.
Crossovers of the ROC and Signal plots with the ZeroLine can help recognize potential entry and exit points.
Input Parameters
| Parameter | Description |
|---|---|
signal length
|
The length of the average to calculate the Signal plot with. |
roc length
|
The length of the rate of change to calculate the ROC plot with. |
rms length
|
The length of the root mean square to calculate the hard limiter with. |
Plots
| Plot | Description |
|---|---|
Timing
|
The Timing plot, a sum of the four last hard limiter values. |
Signal
|
The Signal plot, a moving average of Timing. |
ROC
|
The ROC plot, the rate of change of Signal. |
ZeroLine
|
The zero level. |
Example*
*For illustrative purposes only. Not a recommendation of a specific security or investment strategy.
