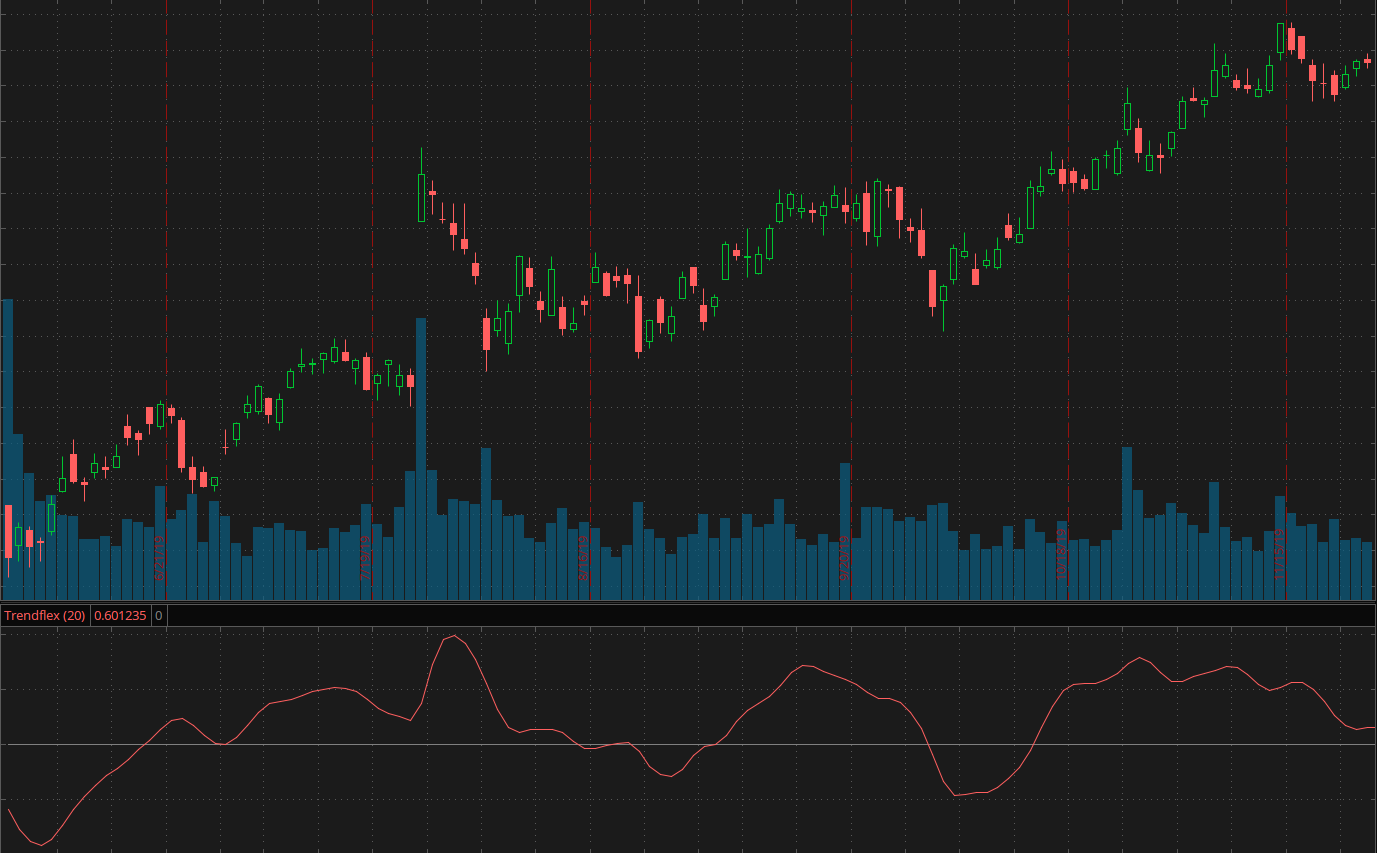
Description
The Leavitt Convolution study is a technical indicator designed by Jay A. Leavitt, PhD. It calculates the extrapolation of the extrapolated price value for the upcoming bars. To derive this value, the study uses linear regression.
The resulting extrapolated value is plotted on the price subgraph. Using multiple instances of the study with different lengths and offsets may help find turning points, detect trends, and give trading signals (see Dr. Leavitt's article referenced in the Further reading section).
Note: Value projection is purely mathematical as all calculations are based on the least-squares averaging of previous values.
Input Parameters
| Parameter | Description |
|---|---|
price
|
The price for which the convolution slope is to be found. |
length
|
The period for which the linear regression is to be calculated. |
bar plus
|
Defines for how many upcoming bars the Leavitt Convolution is to be calculated. |
Plots
| Plot | Description |
|---|---|
LeavittConvolution
|
The Leavitt Convolution histogram. |
Further reading
1. "Trading The Tech Emini With The Leavitt Convolution" by Jay A. Leavitt, PhD. Technical Analysis of Stocks & Commodities, January 2020.
Example*
 *For illustrative purposes only. Not a recommendation of a specific security or investment strategy.